The beatings shall continue. DNS -276, -53, -32.
MNTA was up 20.9% today. I was fortunate that SPRD and MIC were up today. Everything else, not so much.
Trades:
I've got just about every position protected with trailing stop loss orders. If everything sells, then I'll just wait for the next cycle. I'm taking no profit for granted.
HAYN hit the 8% TSL, +9.9%.
VRTS hit the 5% TSL, +5.5%.
CVI hit the 4% TSL, +1.7%.
The contingent order on my MSCC call options fired and filled, +9.6%.
Reversal alerts: (1).
AEM - kind of a long shot.
Monday, October 31, 2011
Saturday, October 29, 2011
Adding BAS to Watch List
It's getting hard to find good growth candidates that haven't already run very well in the last 3-1/2 weeks.
My earlier strategy as we came out of the bottom was to buy many small positions in my favorite stocks and rotate out of the losers into the winners. But after so many stocks ran so well I was content to let the winners drift down into trailing stop loss orders and sell, then I'd buy something at the bottom of the cycle.
So here we are with oil above $93, and the under-performers are fewer and of lesser quality. On that cautionary note, here's the latest addition to the watch list, BAS. With consistent quarterly sales growth above 60%, and sustaining a higher level of earnings while shedding losses to drop the P/E from 37 to under 9.
| EPS Growth | |||
|---|---|---|---|
| Prev Yr | Past Yr | Growth | P/E |
| -0.61 | -0.05 | 91.8% | - |
| -0.54 | -0.46 | 14.8% | - |
| -0.27 | 0.41 | 251.9% | - |
| -0.23 | 0.66 | 387.0% | 37.4 |
| Next Two Quarters (est) | |||
| -0.05 | 0.61 | 1326.0% | 16.62 |
| -0.46 | 0.59 | 227.2% | 8.86 |
| Sales Growth | ||
|---|---|---|
| Prev Yr | Last Yr | Growth |
| 128.1 | 212.9 | 66.2% |
| 143.0 | 246.1 | 72.1% |
| 175.1 | 296.9 | 69.6% |
| 197.3 | 346.0 | 75.4% |
Holdings
Here's what I've got right now along with its performance. Option gains are computed using intrinsic value only.
| REIT | ARR | 5.3% | |
| NLY | -5.8% | ||
| Advertising | FMCN | 78.6% | call spread |
| Chemicals | CF | 30.4% | |
| Food | GMCR | -6.5% | |
| GMCR | 78.6% | call spread | |
| Infrastructure | MIC | 7.5% | |
| Investment Svcs | VRTS | 9.7% | |
| Metals | HAYN | 17.9% | |
| LIWA | 3.1% | ||
| Oil | CVI | 6.1% | |
| KEG | 13.5% | ||
| RES | 2.9% | ||
| Semiconductors | MSCC | 7.5% | |
| MSCC | 23.9% | call | |
| SPRD | 52.0% | call |
Friday, October 28, 2011
Good Enough
Not a bad close considering yesterday's run and the fact the markets were underwater most of the day. DNS +23, -1, +1.
Watchlisters up 8% or more are JDAS, AMD, JKS, VDSI, GMCR, and MIPS.
Trades:
UEPS opened up 14% so that got sold from two accounts when it drifted down into a red tape, +13.4% and +9.0%.
Portfolios:
This great week brought the porfolios up considerably. The ESG port is at -10.55% with 8 of 37 positions above water (the most ever) and the Value-Sales port moved up to +12.97%.
Reversal alerts: none.
Thursday, October 27, 2011
Ca-Ching!
A proposed resolution to the Greek quagmire sent the markets flying. DNS +340, +88, +43.
Watchlisters gaining over 15% today were VDSI (29.5%), VIT (25%), CWEI (22.9%), NEWP, MS, YGE, and SWS.
Portfolio members with a good showing were VRTS (11.5%), HAYN (11.4%), KEG (8.5%), and RES (8%).
Trades:
Some early volatility sent GTLS into the 8% TSL at 10 am, +12.2%.
TAL hit the 8%-er and SPRD the 7% TSL around 11 am, +5.2% and 15.6% respectively. I still have SPRD call options.
Reversal alerts: (1), junk.
Wednesday, October 26, 2011
Schizophrenic Day
Start strong, tank, finish stronger. That was enough to drive someone crazy. DNS +162, +12, +13.
ANAD topped the other watchlisters with a nice 18% gain. Portfolio members SPRD, GTLS, WPRT, KEG, and CVI were up between 5.1 and 7.7%.
Trades:
WLL hit the 8% trailing stop, +11.4%.
My nemesis GMCR continued to vex me. It looked like it bottomed, I bought more to dollar cost average. Then it went down. Then it went down more. I threw up my hands and sold my first, most expensive position, -36.2%. Then it went up. I lost money on both trades. Grrr. No, Gmcrrrr.
I bought CVI and UEPS shares as mentioned in the last post.
The sale of the GMCR gave me some extra cash so I re-bought HAYN shares which I wanted to do since HAYN was hammered yesterday, and was down another 4% today. That worked out okay because it rebounded and the position closed the day up 4.7%.
While I was selling GMCR shares, I was buying GMCR's November $55/$60 call spread for $2.80. [I just noticed that I bought November options, not Friday's weekly options. Gmcrrrr.]
Reversal alerts: none.
+ GMCR, CVI, UEPS
CVI is a deal.
GMCR might have bottomed.
UEPS is speculative. (See tables in previous post.)
GMCR might have bottomed.
UEPS is speculative. (See tables in previous post.)
CVR Energy Inc. (CVI)
| EPS Growth | |||
|---|---|---|---|
| Prev Yr | Past Yr | Growth | P/E |
| -0.16 | 0.27 | 268.8% | - |
| 0.11 | 0.03 | -72.7% | - |
| -0.14 | 0.53 | 478.6% | - |
| 0.01 | 1.44 | - | 11.8 |
| Next Two Quarters (est) | |||
| 0.27 | 1.65 | 510.4% | 7.28 |
| 0.03 | 0.73 | 2320.0% | 6.11 |
| Sales Growth | ||
|---|---|---|
| Prev Yr | Last Yr | Growth |
| 811.7 | 1031.2 | 27.0% |
| 921.9 | 1148.2 | 24.5% |
| 894.5 | 1167.3 | 30.5% |
| 1005.9 | 1447.7 | 43.9% |
Tuesday, October 25, 2011
Easy Come, Easy Go
Today's action seemed like the exact opposite of yesterday's. DNS -207, -61, -25.
Just when you think you're out of the woods with GMCR it goes down 12.2%. Sheez.
Trades:
PTEN's move up yesterday gave me a chance to put a 6% trailing stop loss under it. It sold today, +5.1%.
HAYN hit its 8% trailing stop to close with a +3.1% gain. Any gain is better than a loss.
I went searching for stocks from the growth screen that haven't run up like crazy in the last three weeks. I found KEG, MIC, and UEPS. The limit buy orders filled for KEG and MAG. UEPS finished up 2.7% for the day.
Reversal alerts: (2).
ACTG has erratic sales and earnings, but the P/E is expected to fall from 73 to 28 in the next two quarters.
Just when you think you're out of the woods with GMCR it goes down 12.2%. Sheez.
Trades:
PTEN's move up yesterday gave me a chance to put a 6% trailing stop loss under it. It sold today, +5.1%.
HAYN hit its 8% trailing stop to close with a +3.1% gain. Any gain is better than a loss.
I went searching for stocks from the growth screen that haven't run up like crazy in the last three weeks. I found KEG, MIC, and UEPS. The limit buy orders filled for KEG and MAG. UEPS finished up 2.7% for the day.
Key Energy Services Inc. (KEG)
| EPS Growth | |||
|---|---|---|---|
| Prev Yr | Past Yr | Growth | P/E |
| -0.65 | -0.01 | 98.5% | - |
| -0.15 | -0.08 | 46.7% | - |
| -0.08 | -0.13 | -62.5% | - |
| -0.08 | 0.25 | 412.5% | 273.8 |
| Next Two Quarters (est) | |||
| -0.01 | 0.31 | 3200.0% | 31.29 |
| -0.08 | 0.35 | 538.8% | 14.02 |
| Sales Growth | ||
|---|---|---|
| Prev Yr | Last Yr | Growth |
| 215.3 | 283.7 | 31.8% |
| 237.6 | 350.2 | 47.4% |
| 252.0 | 391.0 | 55.2% |
| 267.8 | 445.4 | 66.3% |
| EPS Growth | |||
|---|---|---|---|
| Prev Yr | Past Yr | Growth | P/E |
| -0.37 | 0.20 | 154.1% | - |
| -0.44 | 0.09 | 120.5% | - |
| -0.10 | 0.24 | 340.0% | - |
| 0.01 | -0.05 | -600.0% | 51.6 |
| Next Two Quarters (est) | |||
| 0.20 | 0.72 | 257.5% | 24.87 |
| 0.09 | 0.77 | 750.0% | 14.82 |
| Sales Growth | ||
|---|---|---|
| Prev Yr | Last Yr | Growth |
| 185.6 | 213.3 | 14.9% |
| 193.6 | 221.5 | 14.4% |
| 201.3 | 239.9 | 19.2% |
| 204.7 | 247.2 | 20.8% |
Net 1 UEPS Technologies Inc. (UEPS)
| EPS Growth | |||
|---|---|---|---|
| Prev Yr | Past Yr | Growth | P/E |
| 0.37 | 0.16 | -56.8% | - |
| 0.42 | 0.22 | -47.6% | - |
| 0.41 | -0.47 | -214.6% | - |
| -0.37 | 0.15 | 140.5% | 116.7 |
| Next Two Quarters (est) | |||
| 0.16 | 0.38 | 137.5% | 25.00 |
| 0.22 | 0.39 | 77.3% | 15.56 |
| Sales Growth | ||
|---|---|---|
| Prev Yr | Last Yr | Growth |
| 65.5 | 64.3 | -1.8% |
| 73.9 | 89.0 | 20.4% |
| 72.3 | 92.8 | 28.4% |
| 68.7 | 97.4 | 41.8% |
Reversal alerts: (2).
ACTG has erratic sales and earnings, but the P/E is expected to fall from 73 to 28 in the next two quarters.
Monday, October 24, 2011
What a Day!
DNS + 105, +62, +16.
I looked at selling GMCR covered calls this morning but decided I didn't want to find my shares sold low in a short squeeze. The frequently overlooked "Do Nothing" option pays off again. GMCR and FMCN were up 8.7% and 8.6% respectively.
Trades:
PVH's second gap up scared me. While that's what we want as investors, I didn't want to be wishing I had sold the December call options when the price falls to fill the gap, so I sold 'em. +28.3% for my account and +129.6% for an untracked account, both less commissions. The call in my account was down 37% at one point, so a +28% return is a nice rebound ... plus the call was purchased so deep in the money it would take a lot to move the return up significantly.
Portfolios:
I usually only report portfolio performance on Friday, but after a move like today's ... ESG is at -15.8%, value-sales is at +7.35%.
Reversal alerts: (1), junk.
Saturday, October 22, 2011
A Decent Week
A second up day got the indexes back to around even for the week. DNS +267, +39, +23.
HAYN and GTLS had a good day with 7.4% and 6.4% gains. From the watchlist, SYNA and ALTR were up 19.1% and 12.2% respectively.
Trades:
I had a $4.99 limit sell order on my $5 GMCR call spread just in case the pricing could take me out early and not be at risk of GMCR's (and the market's) volatility. The well ITM spread got swept just before the close costing me a penny per share plus commissions. Oh well, +48.4% for a one day investment will have to do.
Portfolios:
I think the ports lost some ground this week. The ESG port is at -18.5%, the value-sales port is at +2.86%.
Reversal alerts: (1), junk.
Thursday, October 20, 2011
Up Down Up
What a ride. DNS +37, -5, +6.
JASO had a nice 24% day on heavy volume. EXM was up 14.3%.
Trades:
OAS hit the trailing stop, +26.0%. ROSE hit its trailing stop, +6.0%.
GMCR started off the day by dropping 9%. I guessed that the second bottom was the low for the day. Again, this was another stock with a high time premium, so I bought a $60/$65 bull call spread that expires tomorrow. That will be good for 50% profit if it can close above $65 tomorrow (now at $68.09).
Limit buy orders filled for WPRT and GTLS shares, both part of a natural gas for trucking play.
Reversal alerts: (1), junk.
Wednesday, October 19, 2011
Afternoon Blues
The market was okay for half the day. DNS -72, -53, -16.
Trades:
Yesterday I was looking to buy calls on FMCN when it spiked down but the time values were excessive. So I decided to sell it and found a December $20/$22.50 bull call spread trading for less than intrinsic value. By the end of the day the bull call spread was well in the money (a 78% return) ... and still is after today's sell-off.
Today my limit buy order for RES shares filled.
I have 8% trailing stop loss orders on everything that was up 10% or more (including CF, ROSE, & WLL), except OAS which has a 6% TSL since it was up 28% for me. CVI triggered its TSL and sold, +5.6%.
GMCR is stinking up the joint. I wish I had put a stop loss order in before it dropped 26%. Now I'm using my least favorite investing strategy ... "Hoping and Praying".
Reversal alerts: (2).
RLRN and IDCC. Neither is very compelling.
Monday, October 17, 2011
2 Steps Back
Mondays aren't very kind lately. DNS -247, -53, -24.
BEXP and OAS held their pre-market gains, SNDA was up 14.5%.
GMCR gave up over 10% as did ENER, EXM, VECO, RBCN, and UTSI.
I wanted back into WPRT but it was up too much when I had the chance. It closed down. Maybe tomorrow.
Trades:
My covered calls for GMCR expired worthless last Friday, so that sale reduced my cost basis by 1%. Only 7.4% more to go to break even after today's flogging. I tried to sell covered calls for this week's expiration but I used a limit order. I should have sold at the bid, hindsight being 20/20 and all.
I sold my fist two ARR positions, -13.1% and -9.9% (not counting the dividends). The first one was bought just before the big secondary and never went positive. The second was good for a while. I figured that if the market continues to rebound, money's going to flow out of ARR's stock so I opted to downsize my position.
I bought shares in WLL.
Feeling I was getting over-weighted in oil drillers, I went for a little more tech and bought shares and calls in MSCC (should have set that limit lower!).
Reversal alerts: (1), junk.
BEXP & OAS
Saturday, October 15, 2011
Growth Screen
Here are 83 stocks that are estimated to grow annual earnings by 50% or more over the next two quarters (P/E_A and PE_B), have 4 quarters or more of sequential sales growth, and four quarters or more of earnings or sales acceleration. Below peak is the percentage the stock price is below the 52-week high. Ordered by lowest forward P/E first.
| Ticker | Company name | Price | Below Peak | PE | PE_A | PE_B |
| CMED | China Medical Technologies | 5.45 | -62 | 10.9 | 5.40 | 4.53 |
| TSO | Tesoro Corporation | 26.70 | -7 | 10.0 | 6.71 | 5.54 |
| HFC | HollyFrontier Corp | 34.62 | -11 | 10.8 | 7.22 | 5.58 |
| VLO | Valero Energy Corporation | 23.62 | -24 | 10.2 | 6.72 | 5.65 |
| CVI | CVR Energy Inc. | 27.01 | -9 | 12.1 | 7.39 | 6.20 |
| MET | MetLife Inc. | 32.17 | -34 | 14.0 | 10.18 | 7.29 |
| ZEUS | Olympic Steel Inc. | 19.40 | -45 | 13.8 | 10.07 | 8.04 |
| CHRM | Charm Communications Inc (ADR) | 8.26 | -35 | 16.5 | 11.80 | 8.60 |
| ENDP | Endo Pharmaceuticals | 29.55 | -34 | 13.8 | 10.33 | 8.62 |
| PSE | Pioneer Southwest Energy | 26.00 | -28 | 16.8 | 12.15 | 9.33 |
| HTGC | Hercules Technology | 9.57 | -17 | 15.7 | 9.12 | 9.62 |
| HSP | Hospira Inc. | 38.07 | -37 | 15.2 | 12.51 | 10.07 |
| ATLS | Atlas Energy LP | 18.98 | -31 | 27.9 | 15.43 | 10.10 |
| KNOL | Knology Inc. | 14.15 | -12 | 29.5 | 21.64 | 10.43 |
| WLL | Whiting Petroleum Corporation | 40.05 | -47 | 16.6 | 12.18 | 10.70 |
| CWEI | Clayton Williams Energy Inc. | 59.57 | -46 | 17.6 | 16.17 | 10.76 |
| MYL | Mylan Inc. | 17.67 | -31 | 19.9 | 16.35 | 11.02 |
| TEN | Tenneco Inc. | 32.56 | -30 | 22.8 | 16.88 | 11.22 |
| XCO | EXCO Resources Inc | 10.85 | -48 | 24.7 | 33.08 | 12.14 |
| MOD | Modine Manufacturing Co. | 11.52 | -36 | 32.9 | 14.05 | 12.22 |
| HOMB | Home BancShares Inc. | 22.62 | -10 | 33.8 | 27.03 | 12.41 |
| VIST | VIST Financial Corp. | 5.75 | -42 | 44.2 | 13.37 | 12.50 |
| PXP | Plains Exploration | 27.52 | -34 | 20.2 | 17.02 | 12.79 |
| HURC | Hurco Companies Inc. | 26.18 | -25 | 23.2 | 15.22 | 13.36 |
| GASS | StealthGas Inc. | 4.05 | -54 | 27.0 | 13.97 | 13.50 |
| KEG | Key Energy Services Inc. | 11.52 | -45 | 288.0 | 32.91 | 14.75 |
| DXYN | Dixie Group Inc. | 2.96 | -41 | 296.0 | 17.41 | 14.80 |
| MSCC | Microsemi Corporation | 18.39 | -26 | 83.6 | 27.91 | 15.16 |
| MIC | Macquarie Infrastructure | 25.38 | -11 | 52.9 | 25.51 | 15.20 |
| SUMR | Summer Infant Inc. | 7.19 | -24 | 25.7 | 22.97 | 15.23 |
| DVOX | DynaVox Inc. | 3.56 | -62 | 27.4 | 18.26 | 15.28 |
| TWI | Titan International Inc. | 18.90 | -40 | 82.2 | 37.65 | 15.38 |
| UEPS | Net 1 UEPS Technologies Inc. | 6.96 | -46 | 116.0 | 24.86 | 15.47 |
| EXXI | Energy XXI (Bermuda) Limited | 26.87 | -28 | 79.0 | 28.43 | 15.49 |
| HSFT | HiSoft Technology | 10.97 | -68 | 43.9 | 33.75 | 15.72 |
| HSC | Harsco Corporation | 22.84 | -38 | 87.8 | 57.97 | 16.18 |
| BX | Blackstone Group L.P. | 13.65 | -30 | 113.8 | 33.13 | 16.67 |
| WBSN | Websense Inc. | 18.80 | -33 | 28.9 | 20.19 | 16.68 |
| GTE | Gran Tierra Energy Inc. | 6.00 | -38 | 30.0 | 19.35 | 16.76 |
| TMH | Team Health Holdings LLC | 20.06 | -17 | 57.3 | 52.38 | 16.77 |
| MMSI | Merit Medical Systems Inc. | 12.95 | -35 | 30.1 | 19.68 | 17.57 |
| MFN | Minefinders Corp. Ltd. (USA) | 14.47 | -24 | 68.9 | 32.59 | 17.65 |
| CVGI | Commercial Vehicle Group Inc. | 9.15 | -53 | 41.6 | 23.46 | 18.30 |
| CVD | Covance Inc. | 48.24 | -24 | 43.1 | 20.94 | 18.46 |
| MSCI | MSCI Inc. | 32.84 | -19 | 33.5 | 24.56 | 21.16 |
| ROSE | Rosetta Resources Inc. | 41.18 | -29 | 49.0 | 33.43 | 21.71 |
| MCP | Molycorp Inc. | 39.09 | -51 | 156.4 | 37.48 | 22.00 |
| KALU | Kaiser Aluminum Corp. | 46.75 | -18 | 42.1 | 32.47 | 22.05 |
| GOLD | Randgold Resources Ltd. (ADR) | 103.28 | -10 | 45.9 | 31.20 | 22.15 |
| ENB | Enbridge Inc. (USA) | 33.60 | -1 | 33.6 | 23.16 | 22.27 |
| MWW | Monster Worldwide Inc. | 8.57 | -67 | 171.4 | 41.20 | 22.43 |
| CKSW | ClickSoftware Technologies Ltd | 9.48 | -13 | 35.1 | 29.26 | 22.79 |
| VQ | Venoco Inc. | 9.08 | -60 | 36.3 | 43.65 | 24.08 |
| IACI | IAC/InterActiveCorp | 41.76 | -5 | 63.3 | 43.77 | 24.64 |
| EOG | EOG Resources Inc. | 83.98 | -31 | 54.5 | 32.61 | 26.16 |
| EGO | Eldorado Gold Corporation | 17.24 | -22 | 43.1 | 34.14 | 26.60 |
| GEL | Genesis Energy L.P. | 25.54 | -14 | 49.1 | 39.72 | 28.04 |
| GTLS | Chart Industries Inc. | 53.26 | -14 | 45.5 | 35.34 | 28.28 |
| AREX | Approach Resources Inc. | 23.56 | -33 | 53.5 | 41.55 | 29.64 |
| MPEL | Melco Crown Entertainment Ltd | 10.91 | -32 | 54.6 | 40.26 | 30.47 |
| ABCB | Ameris Bancorp | 9.65 | -14 | 193.0 | 43.08 | 31.54 |
| VRSN | Verisign Inc. | 30.48 | -19 | 112.9 | 78.35 | 31.78 |
| OAS | Oasis Petroleum Inc. | 27.60 | -24 | 95.2 | 50.46 | 32.02 |
| CWH | CommonWealth REIT | 18.90 | -35 | 57.3 | -630.00 | 33.16 |
| SSW | Seaspan Corporation | 13.28 | -38 | 69.9 | 8.26 | 33.79 |
| ENV | Envestnet Inc. | 10.94 | -38 | 68.4 | 45.02 | 34.19 |
| CLUB | Town Sports International | 8.14 | -18 | 81.4 | 42.84 | 35.39 |
| PCOM | Points International Ltd. | 9.65 | -21 | 87.7 | 71.48 | 36.42 |
| ALLT | Allot Communications Ltd. | 12.93 | -32 | 61.6 | 48.25 | 39.91 |
| KRNY | Kearny Financial Corp. | 9.49 | -9 | 79.1 | 63.27 | 47.45 |
| SNCR | Synchronoss Technologies Inc. | 27.96 | -22 | 559.2 | 131.89 | 51.87 |
| MCHX | Marchex Inc. | 9.09 | -16 | 454.5 | 83.39 | 51.94 |
| GMCR | Green Mountain Coffee Roasters | 92.09 | -21 | 90.3 | 70.24 | 56.32 |
| MLNX | Mellanox Technologies Ltd. | 34.34 | -7 | 381.6 | 122.64 | 58.90 |
| WRE | Washington Real Estate | 28.68 | -17 | 124.7 | 108.23 | 62.35 |
| HCN | Health Care REIT Inc. | 48.13 | -13 | 209.3 | 82.98 | 66.85 |
| AZPN | Aspen Technology Inc. | 17.02 | -5 | 189.1 | 97.26 | 69.75 |
| ALXN | Alexion Pharmaceuticals Inc. | 66.80 | -5 | 109.5 | 89.30 | 72.14 |
| BRE | BRE Properties Inc. | 45.55 | -16 | 759.2 | 261.78 | 76.17 |
| KNSY | Kensey Nash Corporation | 27.35 | -9 | 143.9 | 297.28 | 81.64 |
| FIO | Fusion-IO Inc. | 25.21 | -32 | 420.2 | 160.57 | 115.64 |
| CRM | salesforce.com inc. | 131.80 | -18 | 659.0 | 367.13 | 194.11 |
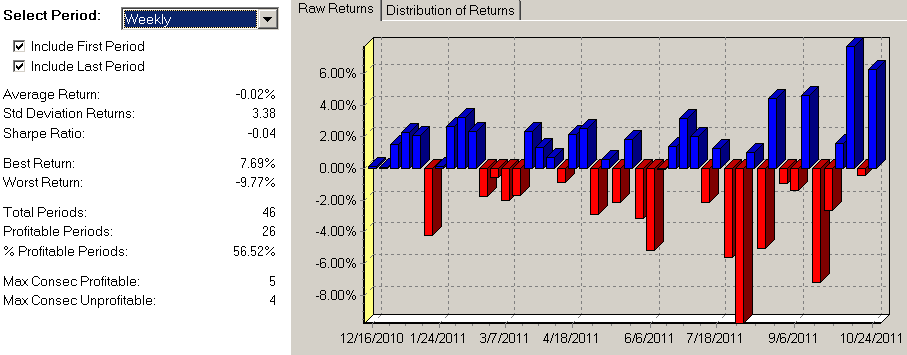
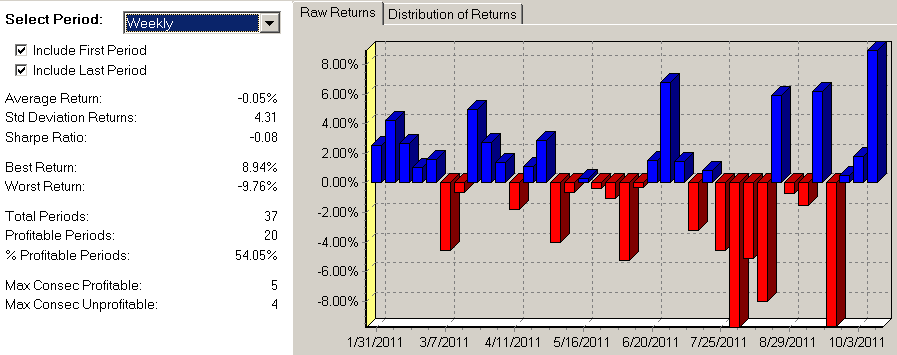
Tea Leaves
Make of it what you will.
Performance charts for a T2 simulation against a universe of 1556 stocks.
Weekly and monthly ...

Performance charts for a T2 simulation against a universe of 1556 stocks.
Weekly and monthly ...

Friday, October 14, 2011
That Was a Nice Week
This week was one of the best in a while. DNS +166, +48, +21.
EXM had another good day, up 14%. EXM, CPX (being acquired), CWEI, and UTSI were up 35% or more for the week.
Yesterday's purchases of OAS and ROSE are up 12 and 10% respectively.
Trades: none.
Portfolios:
Both portfolios improved dramatically over last Friday's close. The ESG port is only down 17.2% with (5) stocks above water (three fractionally). That's the best it's ever been since it was launched into the correction. The value-sales port in back in the black with a 5.47% return.
Reversal alerts: (4).
FSLR has been alerting but Cramer and others say "Stay away!" from the solar companies. While the earnings estimates are being revised downward, the sales estimates are still very strong and the earnings are estimated to go to new levels with strong growth (28% and 128% YoY quarterly EPS growth estimated for the next two Qs). The P/E is dropping from 9.6 to 6.3. Compare to JKS.
SSRX has double digit sales growth and P/E growth that will drop the P/E from 20 to 15.6.
RLRN is only 2% off its highs, so I'm not even sure why the t2 script is alerting on it. There's almost no growth here and it's holding a P/E around 19.8 with a 1.9% yield. More of a curiosity really.
NNN has almost flat earnings and sales, a horrible chart, but a 6% yield. The P/E should drop from 31 to 27.9.
Thursday, October 13, 2011
Shotgunning
Nice dive in the morning then the markets improved the rest of the day. DNS -41, +16, -4.
Stocks were down. Oil was down. I went shopping.
I'm buying lots of smaller positions which I'll either thin out or add onto based on performance. I'll also allocate some cash for buying reversal alerts with the right combination of chart and fundamentals.
Trades:
I bought CVI, more GMCR, HAYN, LIWA (speculative), OAS, ROSE, SPRD, TAL, and VRTS.
I bought call options on SPRD.
All were bought with limit orders - no chasing.
Reversal alerts: (3), duds.
Wednesday, October 12, 2011
Missing the Boat?
I was waiting for another sell-off to pick up more positions but I'm feeling more and more left behind. DNS +103, +22, +12.
Shippers FRO and EXM had a good day (> 14.8%). Favorites FMCN and SPRD added another 7%.
GMCR seemed to be down on the Mr. Coffee deal.
Reversal alerts: (6).
CNS is the only one to consider here.
Shippers FRO and EXM had a good day (> 14.8%). Favorites FMCN and SPRD added another 7%.
GMCR seemed to be down on the Mr. Coffee deal.
Reversal alerts: (6).
CNS is the only one to consider here.
Tuesday, October 11, 2011
Sloveni-who?
So we check out the financial news this morning and the futures are down because of Slovenia. Seriously? Is the financial press playing "pin the tail on the donkey" with a world map? Fortunately we held up okay today which is great. We're starting to see strong "up" days and minimal losses on "down" days. DNS -17, +17, +1.
Trades: none.
Reversal alerts: (9).
All of the reversal patterns look pretty weak, but those with some growth, lowest forward P/E first: OVTI, HWCC, ADPI, CVTI, and ONE.
Trades: none.
Reversal alerts: (9).
All of the reversal patterns look pretty weak, but those with some growth, lowest forward P/E first: OVTI, HWCC, ADPI, CVTI, and ONE.
Monday, October 10, 2011
Friday, October 7, 2011
Moderating
It was nice to have a day that wasn't up or down 200 points. DNS -20, -27, -10.
Trades:
I sold some covered calls on GMCR. $100 strike for next week's expiration.
Portfolios:
The ESG port improved marginally to -25.9% as did the value-sales port, to -3.1%.
Reversal alerts: (5).
TACT has a better chart, CNS has better numbers.
Trades:
I sold some covered calls on GMCR. $100 strike for next week's expiration.
Portfolios:
The ESG port improved marginally to -25.9% as did the value-sales port, to -3.1%.
Reversal alerts: (5).
TACT has a better chart, CNS has better numbers.
Thursday, October 6, 2011
Done Bushwhacking?
We're probably not out of the woods yet, but it's encouraging. DNS +183, +46, +21.
Trades:
I got a little nervous and sold my FMCN calls, +59.0%. Not bad for four trading days I guess.
My limit order for GMCR shares filled before it went up. I picked GMCR for the accelerating sales growth (+125% YoY MRQ) and very strong earnings growth. Plus it was one of the few that hasn't launched off of the bottom. I'm not eager to buy after a three day rally where some of my picks have climbed 12 to 20%. Someone somewhere will sneeze, and it will sound like "Greece", and they'll drop 10%.
Reversal alerts: (27).
Three alerts were from the hlr script. The other twenty-four were from the more reliable T2 script. Filtered somewhat and by lowest forward P/E first: CPX, WTI, NLY, RPC, MOS, NR, JOYG, BHI, NIHD, BAS, IPGP, and PCLN.
Up Again
DNS +131, +56, +20.
No trades.
Reversal alerts: (192).
Filtered for growth, etc., lowest forward P/E first: VLO, OC, PXP, EXXI, GTLS, OAS, GLNO, and GMCR.
No trades.
Reversal alerts: (192).
Filtered for growth, etc., lowest forward P/E first: VLO, OC, PXP, EXXI, GTLS, OAS, GLNO, and GMCR.
Tuesday, October 4, 2011
More Craziness
The afternoon gave us a nice "Suckers' Rally" to close out the day's ride. DNS +154, +69, +25.
Trades: none.
My FMCN rebounded nicely, up 25.9%. I'll take it.
Reversal alerts: (65).
Filtered for growth, lowest forward P/E first: WNR, HURC, NWPX, RBN, ROSE, and EOG.
Trades: none.
My FMCN rebounded nicely, up 25.9%. I'll take it.
Reversal alerts: (65).
Filtered for growth, lowest forward P/E first: WNR, HURC, NWPX, RBN, ROSE, and EOG.
Monday, October 3, 2011
Brutal
Wow, that was a bad start to my predicted "up" week. DNS -258, -80, -32.
SLV and GLD were up. PPDI is going private; it was up 25%. And that was about it.
Trades:
I had a very low limit buy order in for ARR, and I'm still in the red for that lot after ARR slid 13%. I hope it just got caught in the downdraft and it's nothing more serious. NLY was also down, 4.75%, so that's reassuring. As reassuring as losing 4.75% can be.
(21) stocks in my watchlist lost 10% or more today. FMCN was up over 9% early on ... it finished down 3%.
Reversal alerts: (9).
DTLK is the only viable pick here.
Sunday, October 2, 2011
One Difference
I was screening stocks and checking out their charts when I found DTE ... a little utility with a 4.75% yield. It was a typo, but one of those happy accidents that give you a different perspective.
DTE
Then, I decide to check out Con Ed (ED) which has a 4.12% yield.
ED
Neither of these win any awards for sales or earnings growth. But as Cramer points out, "market valuation means nothing right now" ... growth is apparently not far behind. But these two have one key distinction when compared to all my growth and value picks ... their charts are not in a nose dive.
DTE
| EPS Growth | |||
|---|---|---|---|
| Prev Yr | Past Yr | Growth | P/E |
| 0.92 | 0.96 | 4.3% | - |
| 0.73 | 0.90 | 23.3% | - |
| 1.38 | 1.04 | -24.6% | - |
| 0.51 | 1.20 | 135.3% | 12.0 |
| Next Two Quarters (est) | |||
| 0.96 | 0.99 | 2.9% | 11.93 |
| 0.90 | 0.85 | -6.0% | 12.06 |
| Sales Growth | ||
|---|---|---|
| Prev Yr | Last Yr | Growth |
| 1950.0 | 2139.0 | 9.7% |
| 2121.0 | 2173.0 | 2.5% |
| 2453.0 | 2431.0 | -0.9% |
| 1792.0 | 2028.0 | 13.2% |
Then, I decide to check out Con Ed (ED) which has a 4.12% yield.
ED
| EPS Growth | |||
|---|---|---|---|
| Prev Yr | Past Yr | Growth | P/E |
| 1.22 | 1.24 | 1.6% | - |
| 0.73 | 0.80 | 9.6% | - |
| 0.80 | 1.07 | 33.8% | - |
| 0.65 | 0.56 | -13.8% | 15.6 |
| Next Two Quarters (est) | |||
| 1.24 | 1.32 | 6.5% | 15.25 |
| 0.80 | 0.69 | -13.4% | 15.70 |
| Sales Growth | ||
|---|---|---|
| Prev Yr | Last Yr | Growth |
| 3489.0 | 3707.0 | 6.2% |
| 3273.0 | 3139.0 | -4.1% |
| 3462.0 | 3349.0 | -3.3% |
| 3017.0 | 2993.0 | -0.8% |
Neither of these win any awards for sales or earnings growth. But as Cramer points out, "market valuation means nothing right now" ... growth is apparently not far behind. But these two have one key distinction when compared to all my growth and value picks ... their charts are not in a nose dive.
Subscribe to:
Posts (Atom)